

Private Equity: The Second Black Hole?
How private equity is beginning to display the same warning signs as private credit

A few months ago, I compared private credit markets to a black hole - an asset class so opaque that it is difficult to see what is happening inside it.
Astronomers have discovered that black holes rarely exist in complete isolation. In many cases, they come in pairs, orbiting one another in what is known as a binary black hole system. And if private credit is one black hole in modern finance, there is another lurking nearby.
This second black hole is private equity (PE).
Smaller than its private credit companion but closely linked to it, PE has attracted far less scrutiny in recent years. Yet this black hole it displays many of the same characteristics: limited profitability, difficult valuations, and growing questions about whether investors will get their money back.
Private Equity: Where is the Money?
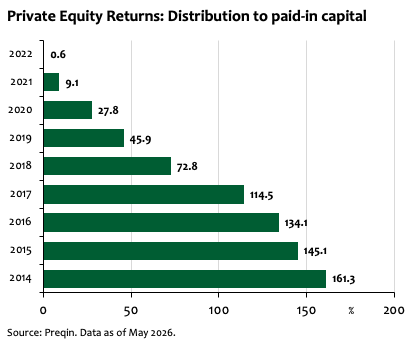
Measuring PE returns can be tricky - one of the most common approaches is to look at a metric known as Distributions to Paid-In Capital (DPI). DPI measures how much cash a PE fund has actually returned to investors relative to the amount originally invested. A DPI of 100% means investors have received back their initial capital. Anything above that represents realised profit.
The chart below tracks DPI by vintage year, with a vintage simply referring to the year in which a PE fund began investing. Unsurprisingly, older vintages have returned substantially more cash than newer ones.
The troubling feature is not that recent funds have low distributions (that is to be expected) but rather how little cash has been returned across almost all post-2017 vintages. Even 2018 vintages have yet to get back to 100% DPI despite having launched eight years ago.
From the outside, investors can still observe reported valuations and respectable performance figures. Yet the flow of cash emerging from the system has slowed to a trickle. Capital continues to disappear into the black hole, but much less is coming back out.
Less Fuel for the Black Hole
Not only is less cash escaping the PE black hole, but less cash appears to be flowing into it as well.
The chart below shows that PE fundraising has been declining for several years. While 2026 is still incomplete, fundraising remains sluggish and is on track to be one of the weakest years for asset gathering since 2018.
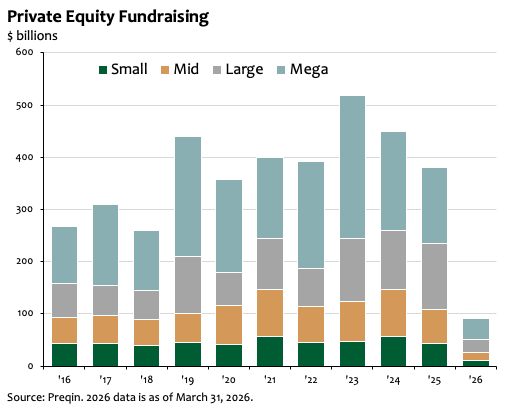
The slowdown is hardly surprising. PE has traditionally relied on a simple bargain: investors lock up their money for long periods in exchange for the prospect of superior returns. But that bargain becomes harder to sell when investors are waiting longer and longer to get their capital back.
This fundraising drought may also help explain why so many asset managers are now attempting to broaden access to private markets under the banner of "democratising private assets". For years, PE was largely the preserve of pension funds, endowments and sovereign wealth funds. Increasingly, however, the industry's attention has shifted towards retail investors.
But PE remains an awkward fit for many retail portfolios. Funds can lock up capital for years, distributions are unpredictable and investors often have limited visibility into the underlying assets. These characteristics may be acceptable for a pension fund with a multi-decade investment horizon, but they are less obviously suited to investors who may need access to their savings at short notice.
Cash is entering the system more slowly than before, while cash distributions to existing investors remain subdued. That does not mean the black hole is about to collapse. Many of the assets inside may ultimately justify their valuations. But when less money is flowing in and little money is flowing out, it becomes increasingly difficult to determine what is really happening beyond the event horizon.
Too Much Tech?
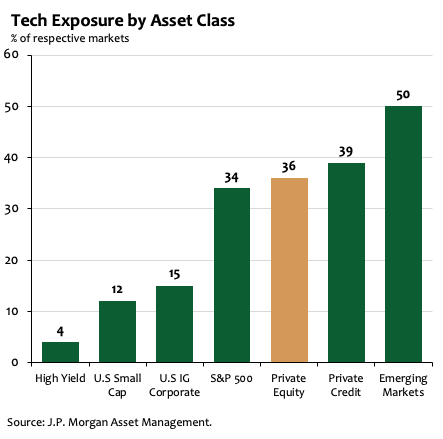
Another explanation for weak fundraising may be the asset class’s growing exposure to technology.
As the chart below shows, PE portfolios now have roughly 36% exposure to technology and AI-related businesses - broadly similar to both the S&P 500 and private credit markets.
This creates a potential problem. Investors often allocate to private assets seeking diversification, yet many portfolios are already heavily exposed to the same U.S. technology ecosystem through their public equity holdings.
As we discussed last week, portfolios are already full of AI and technology exposure. It is therefore possible that some investors are becoming reluctant to commit even more capital to an asset class that increasingly resembles another bet on the same theme.
How Stable are the Black Holes?
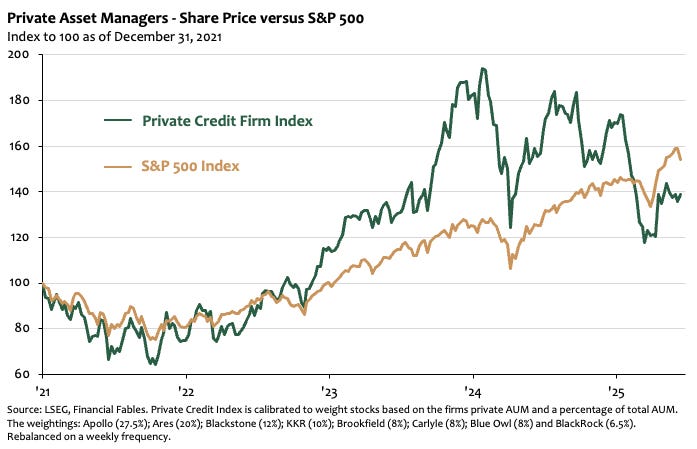
It has been a turbulent year for private assets. The challenge for investors is that it remains difficult to assess the true stability of the black hole. One way to gauge sentiment is through the share prices of listed private asset managers.
As the chart below shows, after an initial sell-off following concerns over private credit redemptions, valuations have largely stabilised.
Part of this resilience likely reflects the broader strength of financial markets. However, fresh liquidity has also emerged from newly established distressed investment funds seeking to capitalise on attractive opportunities..
PE is likely a less systemically important concern than private credit. Weak returns are easier to absorb given the underlying equity structure, and the long-term nature of investor capital reduces the liquidity pressures that have recently emerged in private credit markets. However, PE still displays many of the characteristics of an unstable black hole, with lower, and lower capital flowing back to investors.
For now, the black holes appear to have partially stabilised, although some funds continue to face redemption pressures. Yet the outlook for PE remains challenging: distributions have slowed, fundraising is weak and heavy exposure to technology leaves investors vulnerable to a reversal in a single dominant theme. The black holes are not about to collapse just yet, but in a market with limited visibility, investors would be wise to keep a close eye on the event horizon.
Disclaimer: The information provided in this blog post is for general informational purposes only and should not be construed as financial, investment, or professional advice. The content is not intended as a solicitation, recommendation, endorsement, or offer to buy or sell any securities or financial instruments. Any reliance you place on such information is strictly at your own risk. Always consult with a qualified financial advisor or professional before making any investment decisions. The author and the website assume no responsibility for any losses or damages that may result from the use of or reliance upon the information provided in this blog post.
The DPI chart is the honest version of the PE story that most managers would prefer you didn’t look at too closely. 2018 vintages at sub-100% DPI after eight years is not a vintage problem, it’s a structural one. The exit environment didn’t cooperate and the IRR figures that looked compelling in the deck haven’t translated into cash in the account.
The tech concentration point is underappreciated. Investors allocated to PE seeking diversification and ended up with a leveraged, illiquid version of what they already owned in their public portfolio. That realisation is part of what’s slowing fundraising — not just the distribution drought.
The democratisation push is the industry’s answer to institutional LP fatigue. Whether retail capital is better suited to absorb the illiquidity and opacity is a question worth asking before the answer becomes obvious.